Extremes in Daily Area-averaged Temperatures & Precipitation
in Maryland in the last 30 days
This dashboard provides a detailed, near real-time look at daily weather trends across Maryland’s climate divisions and counties in the previous 30-day window. These plots are designed to contextualize current weather events characterized from daily temperatures and precipitation within the long-term historical record. This analysis displays daily mean, maximum and minimum temperatures in °F, and daily accumulated precipitation in inches from NCEI's nClimGrid-Daily area-averaged dataset. Note that the latest data is three days behind today's date.
To provide a comprehensive view of our regional climate, each plot incorporates several layers of data:
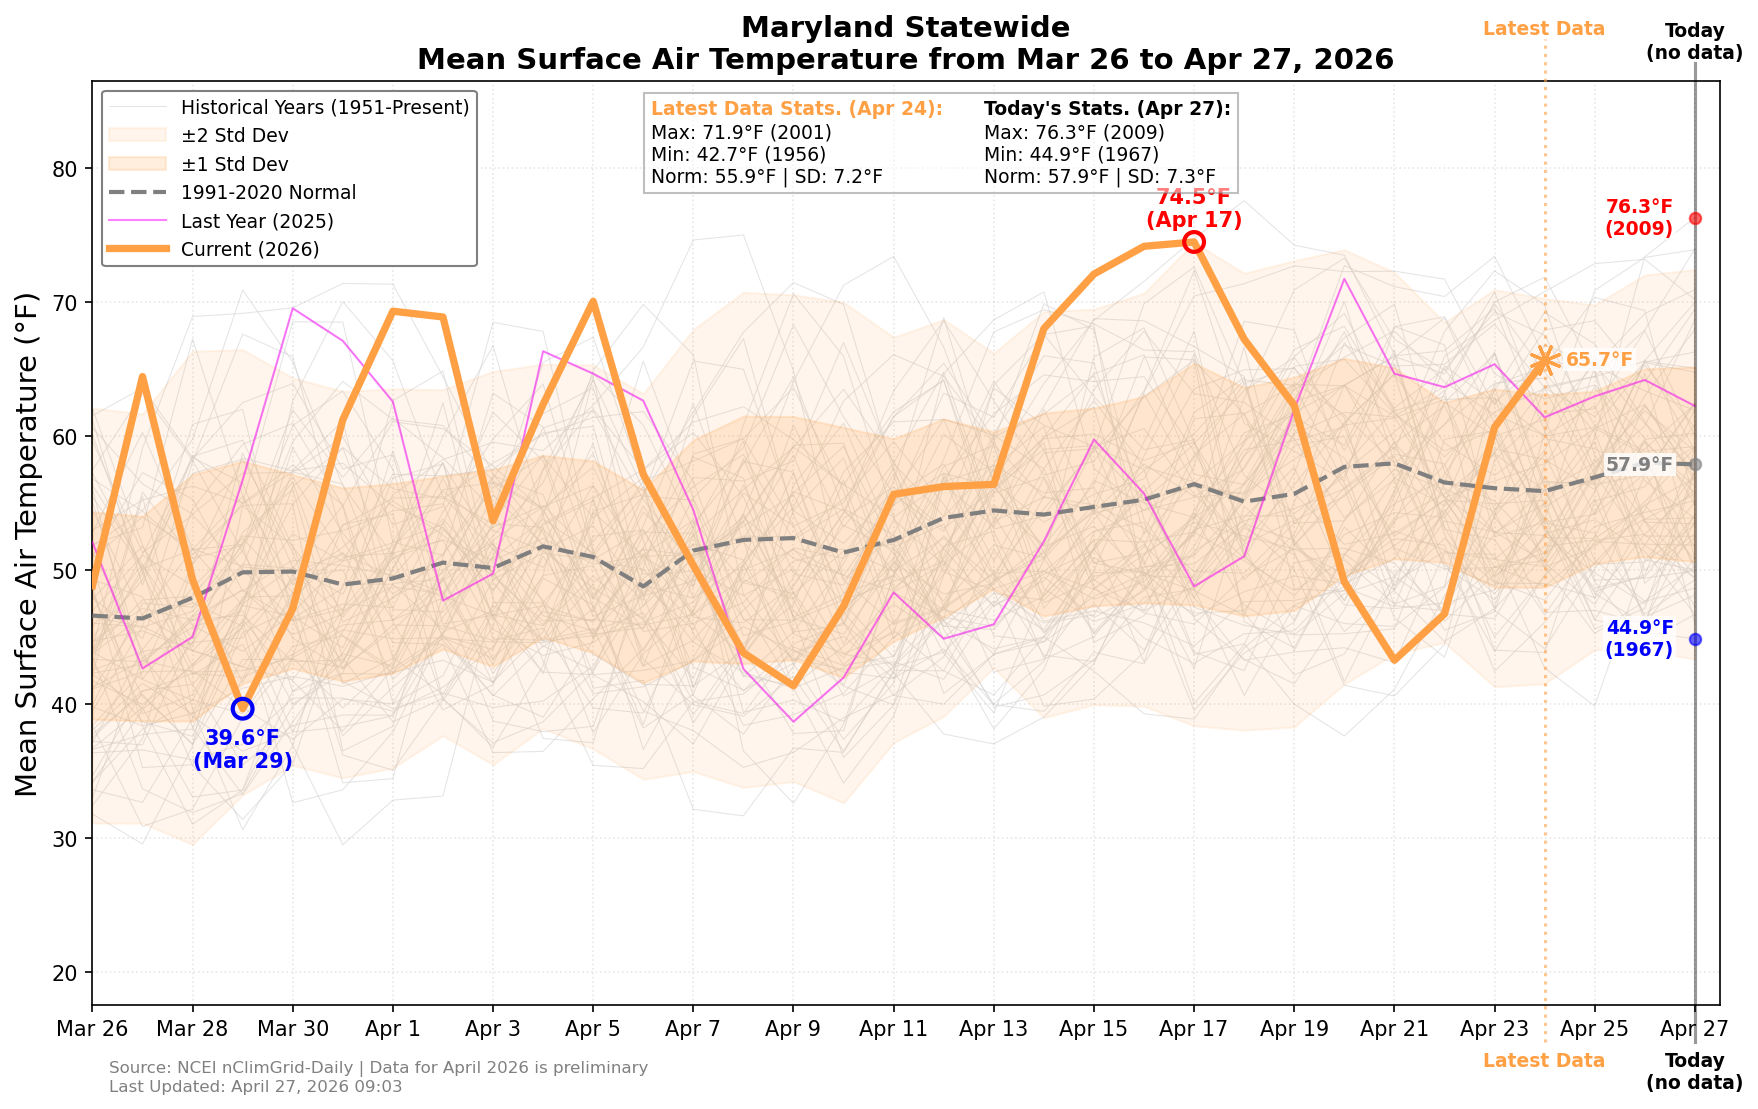
- Current Data (Solid Colored Line): Represents the observed values for the previous 30 days window with data. The terminal asterisk (*) identifies the most recent available data point (Latest Data). The mean surface air temperature, maximum surface air temperature, minimum surface air temperature, and total precipitation are displayed with orange, red, blue and green colors,respectively.
- Historical Cloud (Light Gray Lines): Each thin gray line in the background represents the path of a single year over the same 30-day window from 1951 to the present, showing the full range of historical variability.
- Climatological Normal (Dashed Gray Line): Represents the 1991–2020 daily average, which serves as the official baseline for "normal" conditions.
- Standard Deviations (Shaded Areas): The colored shaded bands represent the ±1 and ±2 Standard Deviations from the 30-year normal. Data points falling outside the ±2 SD band (the lighter outer shading) are statistically rare events.
- Highs and Lows in the current 30-day window: The circles labeled with dates and values highlight the maximum (red) and minimum (blue) values recorded within the last 30 days.
- Record Extremes for Today's date: The dots on Today's date highlight the historical maximum (red) and minimum (blue) values in the period 1951-2025, and the normal (gray) value from the 1991-2020 period.
- Historical Records Box: The box in the upper right compares the latest observed data (Latest Data) against the all-time historical records (Max/Min) and the calculated Normal/Standard Deviation for those specific calendar days.
Plots are derived utilizing area-averaged temperature data from NOAA’s National Centers for Environmental Information (NCEI) nClimGrid-Daily operational framework. Due to institutional quality assurance protocols, real-time records are subject to a nominal 2-to-4 day compilation lag. Active ongoing month points utilize preliminary execution files which are automatically updated as final, scale-adjusted datasets are archived by NCEI. The nClimGrid-Daily dataset is derived from morning and midnight observations from the Global Historical Climatology Network-daily (GHCNd) dataset, and contain processing techniques that address the spatial and temporal variations that affect the quality and homogeneity of the fields.
1. Variable
2. Region
(Click image to view full size)
Maryland Statewide: Surface Mean Air Temperature.
Historical records (1951-2026) and their year of occurrence, climatology and standard deviations (1991-2020) for the day of the Latest Data and Today are displayed in the upper right boxes. Note that besides the daily climatology line (dahsed gray), the previous year (2025) is also displayed with a thin, violet line for comparison purposes.