Growing Degree Days and Accumulated Energy in Maryland
This monitoring platform is inteded to monitoring the thermal evolution of agricultural and infrastructure indicators on the broad scale. This approach is useful if considered as a climate impact tool but it smooths out localized microclimates so it must not be used for precise, actionable agricultural or pest management decisions.
Degree days represent the difference between the daily mean temperature (calculated as the average of the high and low temperatures) and a predefined base temperature. Since energy demand is cumulative, degree-day totals are typically calculated on a daily, monthly, seasonal, and annual basis. Growing Degree Days are used to estimate the growth and development of plants and insects during the growing season, under the assumption that development occurs only if the temperature exceeds a minimum development threshold temperature, or, in other words, if enough warmth is accumulated. Or in other words, in order to trigger a phenological change in plants or egg hatching in insects a specific number of growing degree days must be accumulated. On the other hand, Heating and Cooling Degree Days are used to get a general idea of the amount of energy required to warm or cool buildings; the base temperature used for this purpose is 65°F, which is considered tolerable for human comfort. This monitoring platform tracks daily accumulations for agricultural development thresholds including Growing Degree Days (GDD), corn-specific Modified Growing Degree Days (MGDD), and Stress Degree Days (SDD) alongside utility infrastructure metrics like Heating Degree Days (HDD) and Cooling Degree Days (CDD). It also follows the freeze-free season by identifying the last freeze of spring and the first freeze in fall.Generally speaking, in Maryland:
- Growing Degree Days with a base of 40°F (GDD40) are used to track cool-season winter cereals and early-season crops (like small grains or wheat) and insect development.
- Growing Degree Days with a base of 45°F (GDD45) are used to track primarily high-value early-spring forages and perennial fruits.
- Growing Degree Days with a base of 50°F (GDD50) are used to track row crops and warm-season vegetables.
- Growing Degree Days with a base of 55°F (GDD55) are used for orchard management and track warm vegetable varieties
- Growing Degree Days with a base of 60°F (GDD60) are used to track hot-weather specialty crops like sorghum or late-season tropical forages
- Modified Growing Degree Days with a base of 50°F, and a ceiling of 86°F (MGDD5086) are used to track corn development.
- Stress Degree Days with a base of 86°F, (SDD) are used to track accumulated environmental heat stress.
- Heating Degree Days with a base of 65°F (HDD65) are used to track building heating utility loads.
- Cooling Degree Days with a base of 65°F (CDD65) are used to track building cooling utility loads.
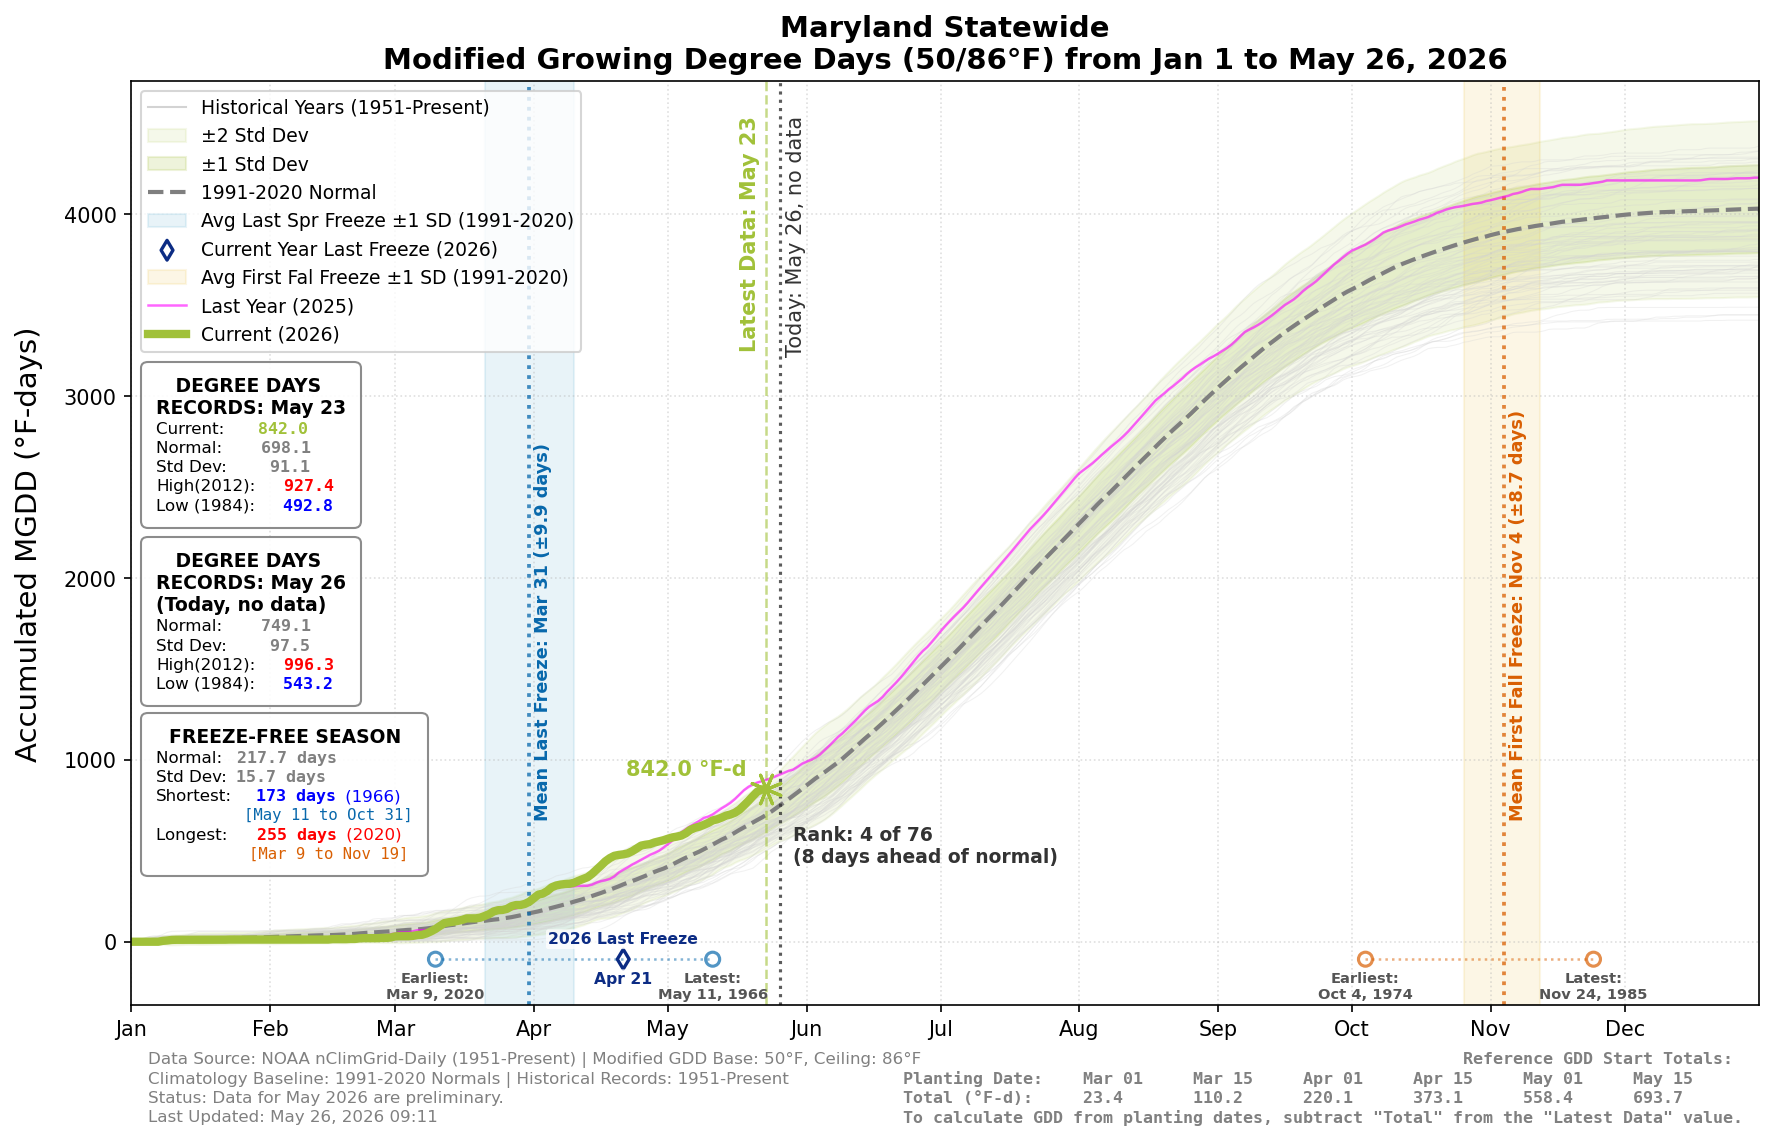
- Observed Accumulations (Thick Colored Line): Represents the ongoing year's trajectory. Growing Degree Days and Cooling Degree Days track along the standard January 1st through December 31st, while Heating Degree Days do it along the July 1st through June 30th. The terminal node symbol (*) denotes the latest updated record index (usually three days behind the current date).
- Climatological Baseline Envelopes: The dashed grey curve is the 30-year, 1991-2020, daily average or normal evolution of the index. The surrounding shaded bands provide visual boundaries tracking ±1 and ±2 standard deviations of variability derived from the same 1991-2020 period.
- Historical Background Matrix (Light Gray Paths): Traces individual years stretching back to 1951, instantly showing where the active year ranks against historic extremes.
- Accounting Reference Tables: Tabulated counters embedded in the lower right footer display cumulative baselines at major key seasonal turning days (e.g., planting or billing dates) allowing quick calculation of localized net-intervals.
- Last Spring Freeze (Dashed Vertical Blue Line):Marks the final time the minimum temperature drops below 32°F in spring. Blue circle markers indicate the historical extremes for the last spring freeze, while a navy blue diamond marks the day of the year-to-date last spring freeze.
- First Fall Freeze (Dashed Vertical Orange Line):Marks the initial time the minimum temperature drops below 32°F in fall. Orange circle markers indicate the historical extremes for the first fall freeze
Data Source: Plots are derived utilizing area-averaged temperature data from NOAA’s National Centers for Environmental Information (NCEI) nClimGrid-Daily operational framework. Due to institutional quality assurance protocols, real-time records are subject to a nominal 2-to-4 day compilation lag. Active ongoing month points utilize preliminary execution files which are automatically updated as final, scale-adjusted datasets are archived by NCEI. The nClimGrid-Daily dataset is derived from morning and midnight observations from the Global Historical Climatology Network-daily (GHCNd) dataset, and contain processing techniques that address the spatial and temporal variations that affect the quality and homogeneity of the fields.
1. Tracking Metric
Agricultural Indices
Energy Indices
2. Regional Level
(Click image to view full-size tracking matrix)
Maryland Statewide: Modified Growing Degree Days (50/86°F)
Statistical records (1951-Present), standard deviations, and dynamic trailing day tracking positions are summarized within the upper-left overlay box arrays. Last year's curve is shown via a thin violet line for year-over-year comparison.