Area-averaged Extreme Heatwaves in Maryland:
January 1 - October 7, 2026
An Extreme Heatwave event is identified when both daily maximum (Tmax) and daily minimum (Tmin) temperatures simultaneously exceed their respective 95th percentile climatological thresholds for three or more consecutive days (e.g., ESOTC 2023). A summary table aggregating regional heatwave statistics for the current year can be accessed via this Summary Table. In this case, the 95th percentiles are calculated for the climatological period 1991-2020, which can be contratsed with those for the periods 1951-2000 and 1951-2025, in these 95 percentiles tables. The 95 percentile for a particular day in a specific 30 year period (or any other legth) is a "smoothed one" calculated as the 95 percentile of five days centered on the target day for each year of the 30 year period so a total of 150 values are used to get the 95th percentile for the target day.
NOTE: Plots and tracking metrics are updated dynamically using NOAA's nClimGrid-Daily dataset.
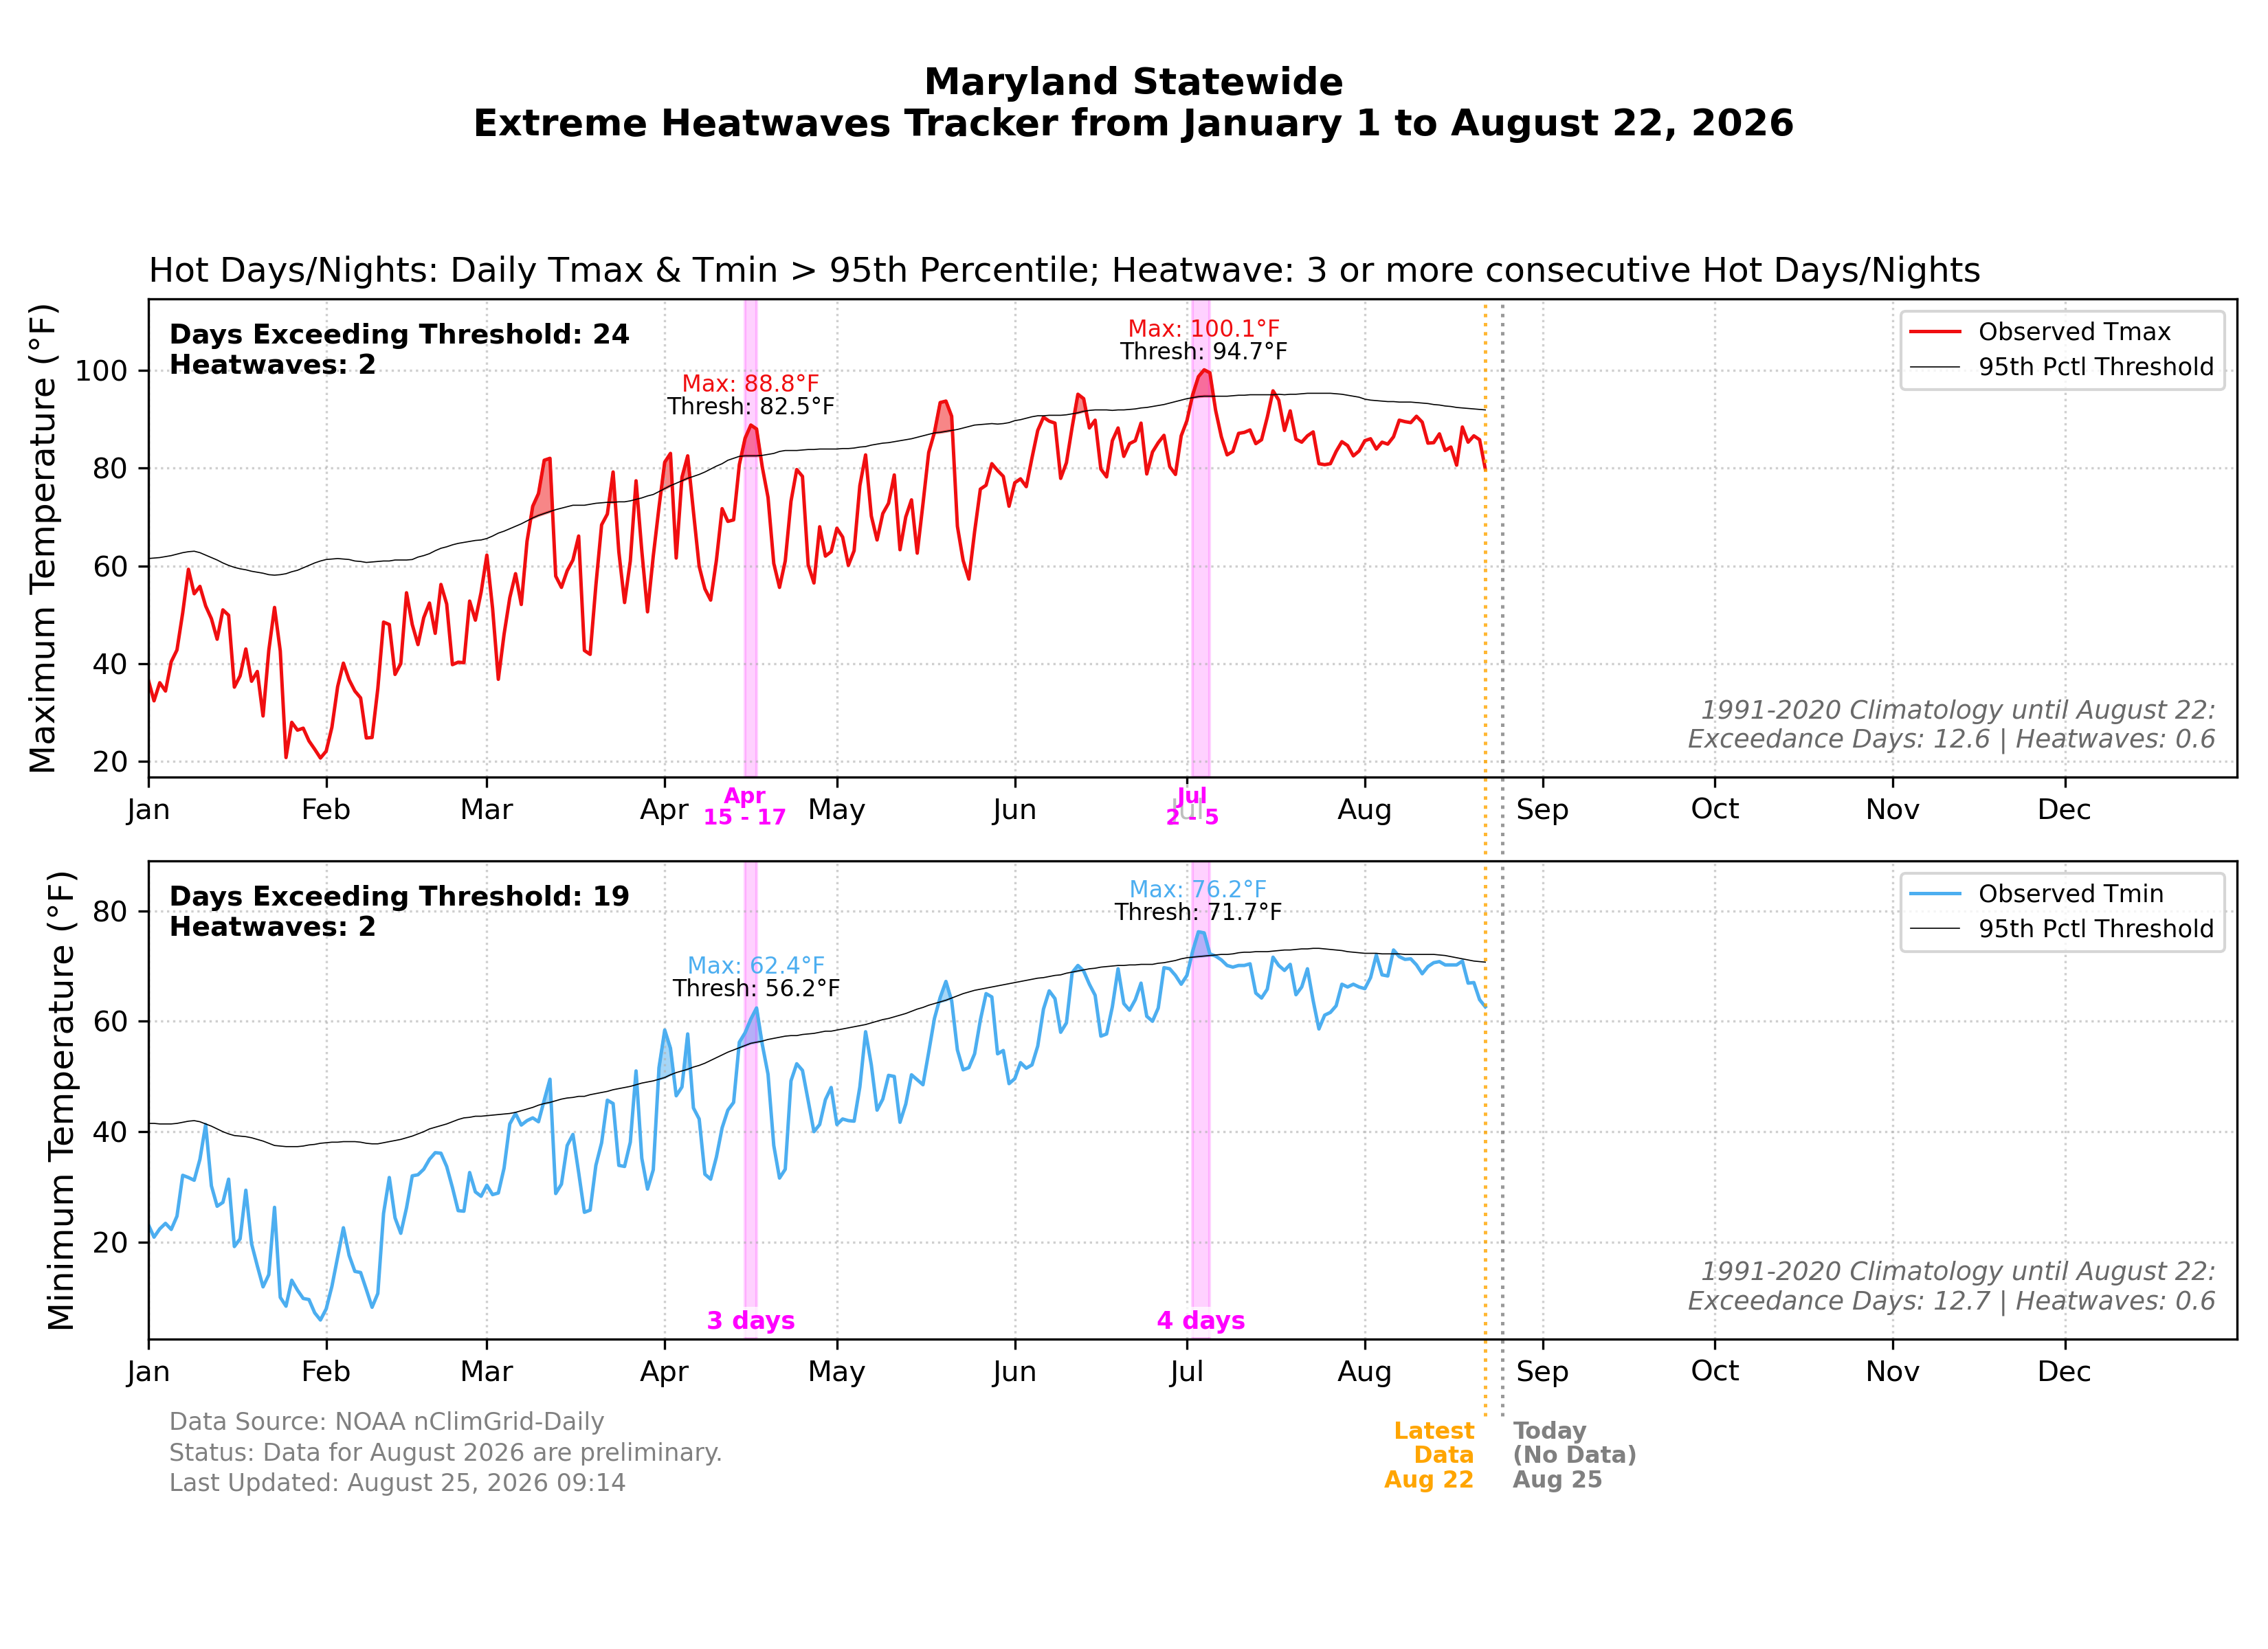
The top panel displays observed daily maximum temperatures (Tmax) against the 95th percentile baseline threshold. The lower panel displays daily minimum temperatures (Tmin). Periods where temperatures simultaneously breach their respective thresholds for 3 or more consecutive days are shaded to denote identified Extreme Heatwave events.